
My interests in data driven decisions and efficient housing has led me to 2 different analyses of my new house in Cincinnati, Ohio. The first is doing a “Heat Load Analysis” based on actual inside and outside temperatures and actual heating data. This gives a very precise indication of how much energy is required to heat my house. There is very little guess work.

If you have heating history for a dwelling, you can perform this analysis pretty easily. It looks at how cold was it outside, how warm did you keep it inside, and how much energy did it take to achieve this. If the temperatures were kept constant, then this would be a very easy calculation. The difficulty comes in because the outside temperature goes up and down. You could have a cold winter or a warm winter. Gas prices could go up or down. This method provides a systematic approach to dealing with these variabilities.
Background
The colder it is outside, the more “HEAT” you need to supply to keep your house at the desired temperature. If your house is not well sealed or insulated, you will also need to supply more HEAT.
It is all about the difference between the inside temperature and the outside temperature, and how long it is cold. This temperature difference combined with the time is what our houses need to deal with in terms of heating. For a given physical location, time period, and indoor temperature setting, we can quantify this environmental energy load that is put on our house. This environment load is measured in Heating Degree Days.
Heating Degree Days
Let’s say the outdoor temperature was a constant 50 ℉ and you wanted your indoor temperature to be 70 ℉. For a period of 1 day (24 hours), this would result in an environmental energy load on your house of 20 Heating Degree Days: 20℉ * 1 day = 20 HDD. I’ll use ℉ throughout this article, but ℃ could be used as the basis as well, you just need to be consistent.
Now we know that generally the temperature does not stay constant. Let’s say that the indoor (purple) and outdoor (green) temps for 24 hours are as depicted in this diagram.
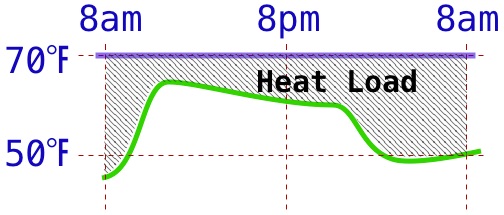
You can start to understand the that the HDD (Heating Degree Days) is the AREA shown in this diagram. This could be difficult to calculate, but we are lucky that someone, the fine people at DegreeDays.net have this data available and you can get the need information from them. See below.
The Heat Load Analysis
Introduction
To make this analysis work, you will need to be able to have a set period, usually a month where you know the amount of energy that you put into heating your house. For me, this is my monthly gas bill that has start and end dates and the CCF (100 cubic feet) of natural gas used during that period. Then, we will match this to the HDD days to see how efficient our house is. But where will we get the HDD value? Luckily, there is a website that will give this to you.
I have put together a Google Sheet that follows along with the descriptions below. You can find it here.
Assumptions
For this analysis, I’m going to be applying the concepts to my house in Cincinnati. If you have a similar setup, then this should be fairly straight forward. If you have differences, you may or may not be able to adjust.
- I live in Cincinnati, OH. Here we need to deal with both heating in the winter and cooling in the summer, but generally, the heating is considered more energy-intensive than cooling, so the focus on making an energy-efficient house starts with the heating side.
- My heating is via Natural Gas. I also have a natural gas heating my water (minor) and for the range in the kitchen (negligible). There are different ways of adjusting for my gas water heater, but that will come about in step 2 (setting my target heating temperature). If you have a different fuel source that is almost exclusively used for heating, like oil, and if you can find your usage for a specific period of time (month, quarter, year) you could probably still complete this analysis.
- I have access to all the needed data and can work a spreadsheet to complete the analysis.
- I will use degrees Fahrenheit [℉], but you could use Celsius [℃] if you are consistent.
Step 1: Gather your gas bill
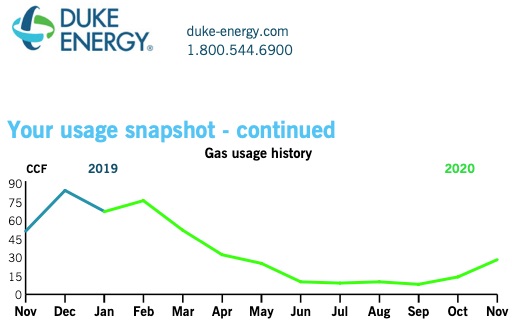
My gas gets delivered and billed by Duke Energy. (I can and do select my own suppliers for both gas and electric, but that is another story.) Duke Energy has historical data from my house’s energy usage. I originally downloaded but later think I found it easier to manually enter the data from each month’s bill.
In the spreadsheet, I have included ALL the available data, but only the GREEN highlighted data is required:
- The period start and end dates: the specific dates matched to the gas consumed below
- CCF (Hundred Cubic Feet) of Natural Gas consumed: My gas consumption is measured in CCF. Sometimes other units are used. You can still do this analysis but will need to do the required conversion.
Step 2: Determine your HDD – Heating Degree Days
(see above for a general description of HDD)
In step 2, we need to know how cold it was during the periods that your house consumed the natural gas to heat the house. There is a wonderful source for this information: https://www.degreedays.net/
You will need to find the closest weather station to your house and then also enter the other parameters:
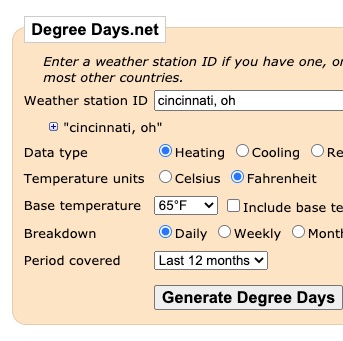
- Weather Station: Search for Closest
- Data type: Heating
- Temperature units: Fahrenheit
- Base temperature: (See below)
- Breakdown: Daily
- Period covered: select a range that will include the winter months from your heating bill.
Base temperature: Here you may need to use a bit of judgment to select the best temperature. For me, I generally just set my thermostat at 68 ℉ and do not have it set back further at night time. Also, I have other sources of heat (people, electronics, etc) so I actually used 65 ℉ as my Base Temp.
Base Temperature selection continued: Generally, you’d always have some additional heat sources and I’d suggest using a minimum of 2 ℉ less than your average nighttime thermostat setting. Also, I know that my gas water heater adds to consumption. You can read more on this selection here.
Once you pull the data, you will have an HDD day value for each of the days in your target analysis periods. You will need to create a SUM for each of these periods. This is why you need to know the specific days that your heating bill covered.
Side note: The results from degreedays.net will also indicate a “Percent Estimated”. For me, these were mostly 0 or very small, so it gives me more confidence in the results.
Step 3: Combine and Analyze
If your data is very similar to mine, it will be easiest for you to just use a copy of my spreadsheet and the formulas that are already here. The analysis part starts at column P. Also, I have added many notes and references at the bottom of this sheet.
Let me start with the end of my analysis so you can see where we are headed. My house “scored” at a “HeatLoad” of 356 BTU/℉-Hr. So, if it were 4℉ outside and I wanted a 68℉ inside, I would expect to need to be continuously supplying about 22,000 BTU/Hr. If you wanted to use this data to size an HVAC system, you’d generally take at least 140% of this number, because we want our homes to be able to be heated up quickly.
If my house was bigger, it is only 1000 ft², this number would be bigger. If my house was better insulated (it is not very well insulated), this number would be lower.
Let me take you though each of the calculations:
- Cell B3, Heater Efficiency: 95% If you look at your HVAC system, it will have a heat conversion efficiency, or you can try to find it by evaluating your unit. Mine is an older high efficiency system and will convert 95% of the energy of the burned natural gas into available heat for heating the house.
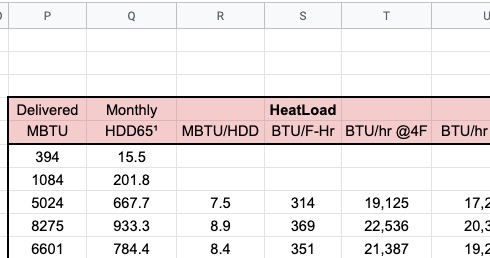
- Column P, Delivered MBTU: This is the energy that has been delivered to the house for the month. The formula takes the delivered volume (CCF) of gas and converts it to MBTU. There is 103,700 BTU of energy for each CCF of natural gas.
- Column Q, Monthly HDD65: This is the sum of daily of HDD found in step 2 and copied here.
- Column R, MBT/HDD: The energy (col P) is divided by the degree-days (col Q).
- Column S: HeatLoad (BTU/℉-Hr), the units of column R are adjusted to the standard for heatload.
- Column T: BTU/hr @4℉, this is the expected rate of heat loss (which equals the required amount of heat supplied) for keeping the house at the design temperature (65℉) give the outside temperature of 4℉.
- Column U: BTU/hr @10℉ similar to column T but for a higher outside temperature.
Why do all this?
This “HeatLoad” gives you an indication of how efficient your house is independent of your source of heat, cost of heat, size of the house, outside temperature, etc. If you now perform efficiency improvements, you could re-run this analysis and should see improvements.
This can also be useful for sizing an HVAC system. Remember that you’ll want a system substantially larger than the minimum size that this analysis shows. Read more at the article that motivated this posting here.
My desire to do this is two-fold. First, I would like to get rid of the non-renewable energy source (natural gas) and more to renewable high efficiency electric heatpump heating. Second, I want to improve the efficiency of my house, but I want to do it in a data-driven manner. So the output of this analysis goes into another analysis where I evaluate where I’m losing the heat. I now a very good indication of how much heat I’m losing and I can distribute that across the lossy areas (walls, windows, ceiling, air exchange, etc) to decide where best to target my money and time. That analysis will be presented shortly.