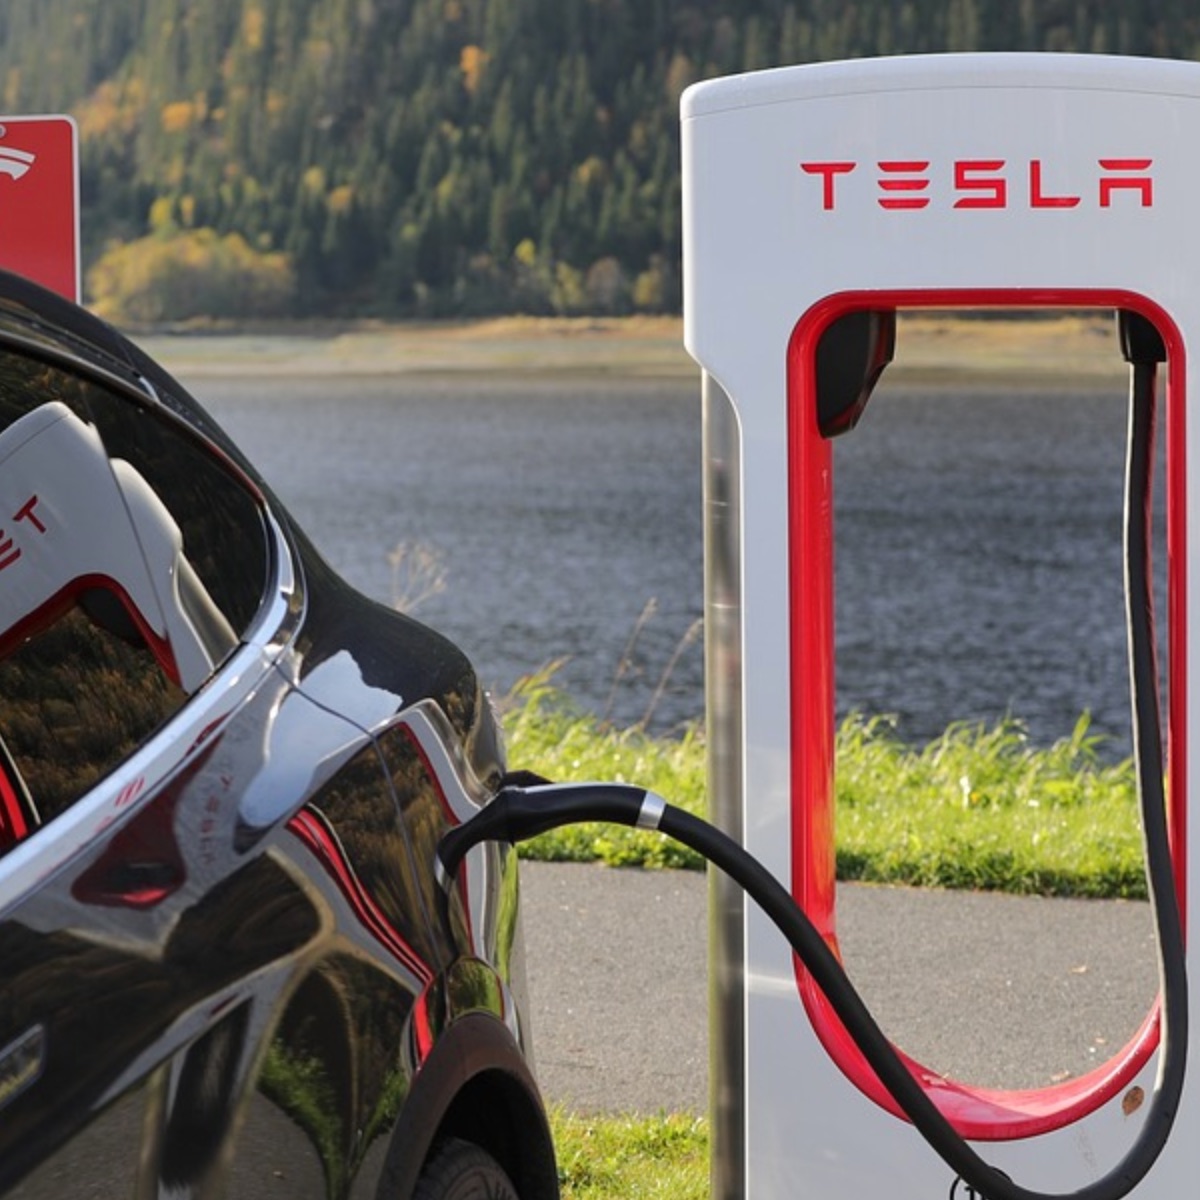
Okay, the primary drawback of battery electric vehicles (BEV) is charging. Well, of course, it is a bit more complicated than that as in many circumstances charging is a benefit of BEV. For example, I as well as many other BEV owners will charge at home and plugin almost every night. This means my car is ALWAYS full of fuel! That is very nice.
The drawback part of charging is for “trip driving.” By trip driving, I mean when you will need to charge your car while away home generally while taking a trip that involve driving. The primary focus of this analysis is home many chargers will be required to support the fueling (charging) of BEVs while they are one trips.
This is a fairly high-level analysis. There are tons of assumptions and simplifications. I still feel the analysis is valid in a directional sense. We are at the beginning of a wild transition to electric vehicles. Actually, it is much more than that, but here I’m focusing on the transition from gas internal combustion (ICE) vehicles to battery electric vehicles, BEVs. If you’d like some interesting background on this transition, there are many places to look but I’ll suggest Tony Seba’s YouTube video from Earth Day 2020.
Any search for Tony Seba will bring back some great stuff. If you would like to check out his books, here is an Amazon Affiliate Link to get you started.
tldr; Conclusions
Okay, let’s get straight to the findings. WARNING: Before you jump to too many conclusion or think I’m way off, please review this whole article because below I describe in more detail what this analysis is all about and that may actually answer your concerns.
Full data and model can be found here.
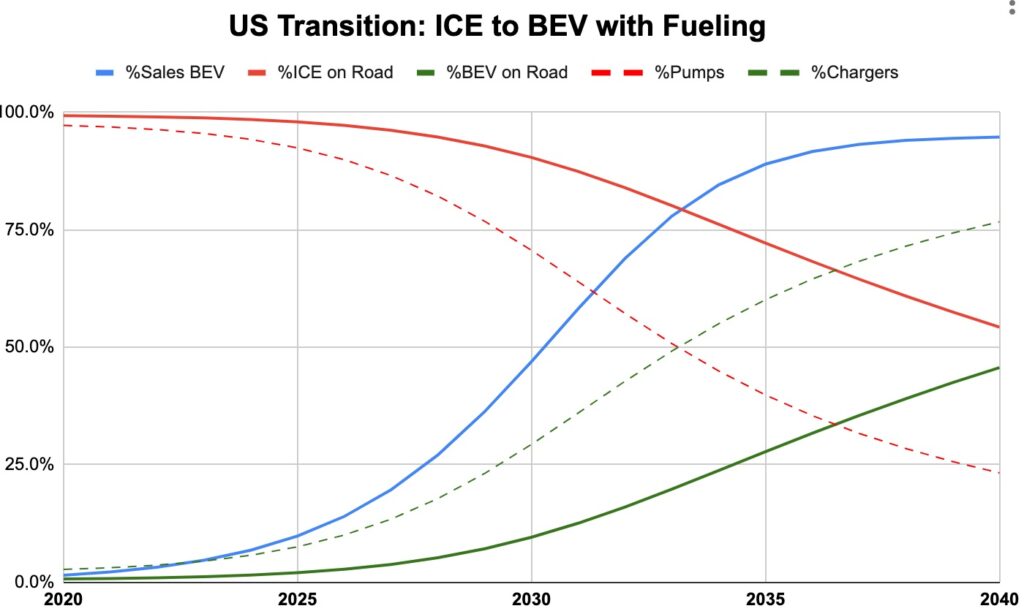
Finding 1: Chargers will need to replace Gas Stations FASTER than BEVs replace ICE vehicles
In this analysis, you see that half of the fueling stations will need to be “Chargers” vs. “Pumps” a DECADE before half of the vehicles will be electric.
From this predictive model, the 50% Charging vs. Gas Pumps will be reached in about 2033, much sooner than the predicted balance of BEVs and ICE cars on the road in 2043.
Finding 2: The percent of BEV cars will trail the sales percent
Even if we hit the dramatic increase in percent sales of BEVs, the percent of BEVs on the road will trail by quite a lot. The ICE cars will continue to have viability for quite a while and will probably have a viable place in the market for many years. Gas cars are actually quite remarkable, mostly because of the energy density of gasoline and the built infrastructure.
The media and forecasters like to focus on this projected S-Curve adoption of EVs. But, independent of whether you agree with this or not, if/when it happens, the percent of BEVs on the road will trail greatly while people still have use for their ICE vehicles. This should not be ignored.
The S-curve I have modeled here is actually much SLOWER than many optimists predict. You can actually use my model (a google sheet) and play around with your own suggestions.
As the demand for gas declines, the price will drop. This will slow the transition.
Finding 3: (My Primary Take) Fueling can make the transition!
If we are able to build and sell EVs at the rate predicted by this model, we will be able to replace the fueling as well. Tesla has moved the world forward in amazing ways. Building out its charging network is certainly a critical part of this. I do wish and hope we converge to more standardize charging though.
Why did I do this? Motivation for this Analysis
Although this may be of less interest to many readers, my motivation for doing this analysis was trying to understand the impact on the requirements of the charging network. With the much slower “Fueling Rate” of a BEV when compared to an ICE, how will we make this transition?
Fueling BEVs is a much more complicated situation than fueling ICE vehicles. For ICE vehicles, you go to the gas station and can gain driving range at a rate of 300 miles of range with a 10 minute stop. I estimate this rate of range increase at 2000 MPH (Miles Per Hour, similar units to driving speed but different meaning).
For BEVs, much of the charging will be done at home. Especially in the “early years” with the early adopters. There will be a mixture of public and private charging available. Some people will have charging available at work.
Analysis Details
Some notes on this analysis.
- This data is for the United States. Different countries can have dramatically different market forces. To keep this simple, I have only looked at the US.
- This analysis is for Trip Driving only. Additional charging will be required to support local driving. Much of this is expected to be supplied at home. Beyond that, there will be work, public, and private options that get built out.
- Plug-In Hybrid cars are a bit of a transitional anomaly. I actually have felt that for today and the next few years that Plug-In Hybrids are an EXCELLENT option. You can get the benefit of being greener and charging at home for local travel. Then for trips, you can rely on the established gas fueling infrastructure and not need to be bothered with the sparse and slow BEV charging that exists today. Over time though, it seems that electric should win out, but in this model, I do have them max out at 95% of new car sales. The remaining will probably be mostly Plug-In Hybrids.
- Battery Technology. Some people and companies feel that the current battery technology is not good enough for mass adoption. My feeling is that dramatically better technology like Solid-State Battery Technology is pretty far off in the future before being available for mass use. During that time, current Lithium-Ion Battery Technology will continue to improve AND its adoption band build-out of infrastructure will make it the strongest player for a long time.
Below are some definitions and details from this analysis.
| %Sales EV | Percent of new car sales that will go to electric with an S-Curve model. Uses adoption rate (top) and 5% long term ICE. |
| ICEs In Use | The numer of ICE (Internal Cumbustion Engine aka Gas) cars will be in use. They get replace by a higher percentage of BEVs as time goes on. |
| BEV Turn | Percent of BEVs that die/crash per year and need to be replaced. |
| BEVs In Use | For this analysis, we hold the total number of cars constant and reduce ICE sales by percent of BEVs, so BEVs are just total – ICE. |
| %BEV | BEVs divided by (ICEs + BEVs) |
| Gas Pumps | Number of gas pumps (not stations) is set to be directly dependent on number of cars. |
| Trip Miles/yr | The DCFCs required to support trip driving in BEVs, is calculated from the total trip miles driven in those BEVs. No driving difference between ICE and BEVs is used. |
| Local | There will be some number of DCFCs required to support BEVs who need local charging. This is not part of this analysis. |
| Trip Support | How many DCFCs are required to support the BEVs trip driving? Calculated purely based on total Trip Miles divided by Miles/DCFC/day (top). Yes this would be an ideal number and require a uniform distribution of cars, trips, and DCFCs. |
| 5xSurge | To balance for un-uniform distribution of BEVs, trips, and DCFCs AS WELL AS temporal demand (weekends, vacation time, etc) a surge factor is applied. Here we use 5. |
| BEV Turn | BEV Turn is not used for this anlysis, but could be used in other calculations of BEVs in use. It was decided the simpler calculation as describe above was sufficient. |